

Box scores lie.
A 20-point night can be brilliant or meaningless depending on matchup, pace, and role.
So what actually moved the needle?
This post lays out a game-level grading system, a 0–100 numeric scale with letter grades, that blends advanced metrics and context to turn raw stats into a single, fair evaluation.
You’ll get the key metrics, how we weight context, and what grades mean for rotations, fantasy lineups, and betting edges.
Here’s how to judge performance beyond the box score.
Comprehensive Game-Level Player Grading Framework

Post-game player grades assign a numeric score on a 0 to 100 scale and convert it to a letter grade. The letter mapping is simple: A = 90–100, B = 80–89, C = 70–79, D = 60–69, and F = below 60. This framework turns raw box scores and advanced metrics into a single digestible number that reflects both statistical output and the situation around it. The numeric foundation keeps things objective. The letter grade tells fans instantly whether their guy delivered or flopped without scrolling through endless columns.
Game context changes every raw grade because identical stat lines can mean totally different things depending on pace, role, matchup, usage, and who else is on the floor. A 20-point performance on high efficiency against a top-five defense while locking up the opponent’s best perimeter threat gets a higher grade than the same 20 points on heavy volume against a rebuilding team’s bench unit. Context weighting separates fair evaluation from surface-level box score reading and captures the difficulty of the assignment, the tempo, and what you’d expect from the player based on his season baseline.
Core grading factors:
- Efficiency output (points scored per true shooting attempt and shot quality)
- Defensive impact (contests, deflections, matchup assignment, team performance with player on court)
- Usage influence (volume responsibility balanced against turnover rate and assist creation)
- Playmaking responsibility (assist rate, potential assists, offensive initiation role)
- Situational and contextual difficulty (opponent strength, pace, rest disadvantage, lineup composition)
- Consistency relative to expectations (deviation from season averages and role-based benchmarks)
Every grade compares the player’s performance to his season averages using percent change, z-score, and percentile rank. A player who shoots 45% from three in a single game when his season mark is 38% earns credit for exceeding expectations. Another who posts a 15 PER when his season average is 22 loses points even if the raw number looks respectable. Deviation from baseline isolates the game-to-game signal from season-long noise and prevents inflated grades for players who chronically underperform their own standards.
Advanced Metrics Breakdown for NBA Player Grades

Advanced metrics refine player grading by converting raw counting stats into rate-based, efficiency-adjusted, context-aware values that allow fair comparisons across different minutes, pace environments, and role expectations. A player who scores 18 points in 22 minutes against a slow-paced opponent is different than one who reaches 18 in 35 minutes during a high-possession track meet. Advanced metrics normalize for these differences and reveal whether the player’s contributions actually moved the needle for his team or just padded a box score during garbage time.
| Metric | What It Measures | Game-Level Application |
|---|---|---|
| True Shooting % (TS%) | Points per shooting possession, adjusting for free throws and three-pointers | Primary efficiency anchor; elite ≥ .600, good .560–.599, average .520–.559, poor < .520 |
| Effective Field Goal % (eFG%) | Field goals made with three-pointers weighted 1.5× because they’re worth more | Quick read on shooting value from the floor, ignoring free throws |
| Player Efficiency Rating (PER) | Per-minute statistical production adjusted for pace and league average | Elite > 25, strong 20–25, average ≈ 15; single-game PER isolates productivity spikes |
| Real Plus-Minus (RPM) | Player’s estimated impact on team net rating per 100 possessions, using adjusted plus-minus | Measures on-court value independent of box score; volatile in single games but useful for context |
| Defensive Rating (DRtg) | Points allowed per 100 possessions while player is on court | Lower is better; elite < 100, average 100–110; isolates defensive contribution from team context |
| Win Shares / 48 (WS/48) | Player’s estimated contribution to team wins per 48 minutes played | Elite ≥ .200, good ≈ .100; translates counting stats and efficiency into win value |
Per-36 and per-100-possession stats normalize for minutes and pace by projecting what a player would produce if given a full starter’s workload or if the game were played at a fixed possession count. Per-36 reveals whether a bench player’s production scales to starter responsibility or collapses under heavier usage, while per-100 removes the noise of tempo variation and isolates true efficiency. A backup center who posts 12 points and 8 rebounds in 18 minutes might project to 24/16 per 36, but his per-100 numbers show whether he’s actually more productive than a starter logging 32 minutes at a slower pace.
Impact and Plus-Minus Metrics for Game Performance Evaluation
On-off court impact, plus-minus, and adjusted frameworks measure how much a team’s net rating (points scored minus points allowed per 100 possessions) changes when a player is on the floor versus when he sits. Raw plus-minus captures the score differential during a player’s minutes but it’s noisy in single games because it conflates teammate quality, opponent strength, and random variance. Box Plus-Minus (BPM) estimates impact using only box-score stats and a regression model, while Real Plus-Minus (RPM) and Adjusted Plus-Minus (APM) use lineup data and opponent adjustments to isolate the player’s true contribution from his supporting cast and matchup context.
Estimated Plus-Minus (EPM) is a predictive metric that reports per-100-possession impact using a player’s entire preceding career and excludes the current game to avoid circular logic. EPM values displayed on stats pages are predictive estimates of how the player should perform, not actual measurements of what he did in that specific game. A game-optimized version of EPM incorporates opponent strength and home-court effects and feeds into game predictions, season simulations, and playoff probability models. It’s a forward-looking tool rather than a backward-looking stat. The difference between predictive EPM and actual game performance is the gap grading systems use to reward overperformance and penalize underperformance.
Single-game impact metrics are volatile because small sample sizes magnify the influence of a few possessions, and lineup combinations rarely repeat exactly across games. A player might post a plus-15 in one outing because his team’s bench mob blitzed the opponent’s second unit, then show a minus-8 the next night despite a better individual performance because he played heavy minutes against the opposing starter lineup. Grades incorporate stabilization rules by blending game-level plus-minus with season-long adjusted impact metrics and limiting the weight of any single possession or lineup stint. This prevents one defensive breakdown or one hot shooting stretch from distorting the overall evaluation.
Shooting Efficiency and Shot Quality in NBA Game Grades
Shot selection and zone efficiency reveal whether a player generated good looks or forced contested, low-value attempts that happened to fall. True shooting percentage and effective field goal percentage quantify results, but shot-quality metrics and location splits explain how sustainable those results are and whether the player’s decision-making deserves credit or criticism. A guard who shoots 50% on heavily contested mid-range pull-ups is less impressive than one who shoots 50% on open corner threes, even though the raw efficiency looks identical. Evaluating the process behind the numbers separates skill from variance and prevents inflated grades for players who got lucky with tough shots.
Key shooting metrics that refine player grades:
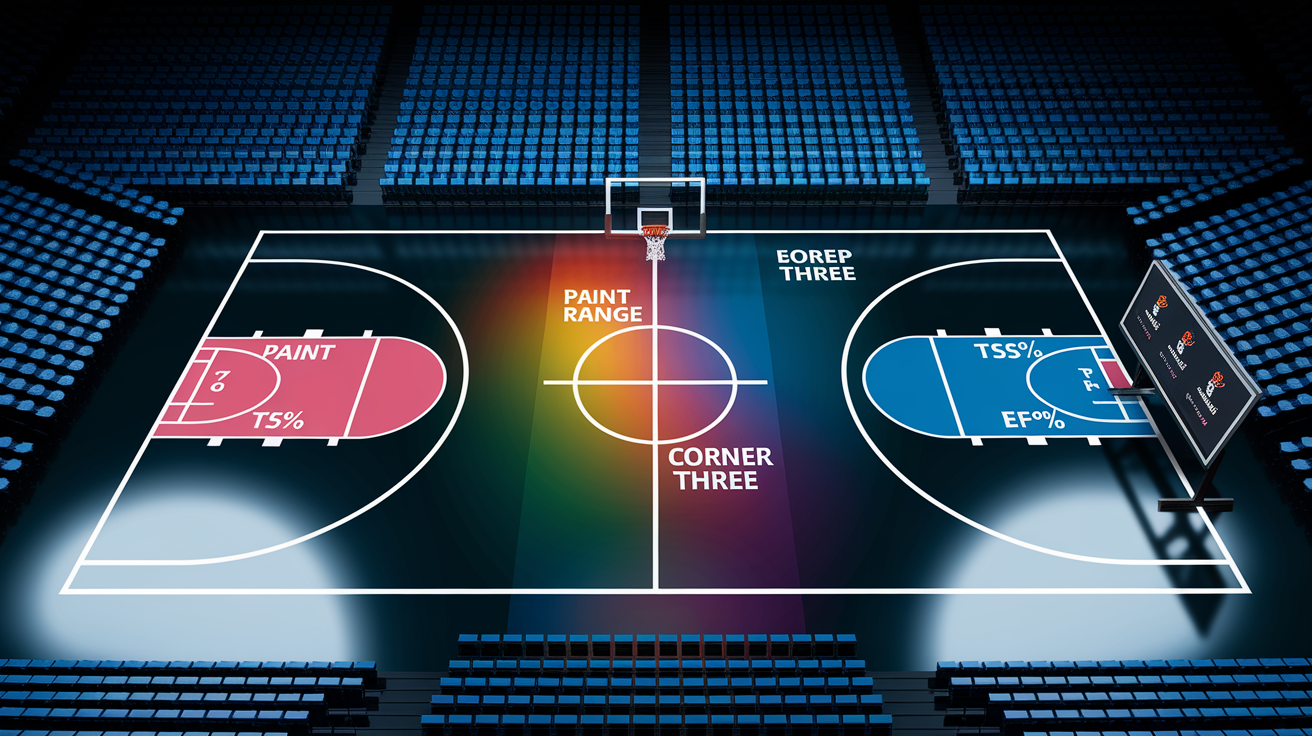
- Shot quality index (measures the difficulty and expected value of the player’s shot selection based on defender proximity, shot type, and historical league-wide conversion rates)
- Zone efficiency (breaks down shooting percentages by court area like paint, mid-range, corner three, above-the-break three to identify strengths and weaknesses)
- Rim finishing percentage (isolates field goal percentage on attempts within four feet of the basket, revealing driving value and contact finishing)
- Corner-three percentage (the highest-efficiency three-point zone; strong corner shooting signals elite spacing and off-ball value)
- Free throw rate (free throw attempts per field goal attempt; high FTR indicates the ability to draw contact and generate efficient possessions)
Heat maps and shot charts enhance grading credibility by visualizing the spatial distribution of a player’s attempts and conversions. A color-coded heat map showing a cluster of makes in high-value zones (rim and corners) justifies a high efficiency grade, while a chart littered with misses from mid-range and deep twos supports a lower mark. These visuals turn abstract percentages into concrete evidence of shot selection, spacing impact, and scoring versatility.
Defensive Metrics and Player Grade Adjustments

Core defensive grading components blend traditional stats (blocks, steals, rebounds, personal fouls) with tracking-based measures (deflections, contests, loose-ball recoveries) and lineup-level impact (defensive rating, defensive win shares, on-off splits). Traditional stats capture visible defensive events but miss the majority of defensive value, which comes from positioning, communication, and deterrence rather than countable actions. A rim protector who forces three shooters to pass out of the paint never shows up in the block column, but his presence fundamentally alters the opponent’s offense. Grading systems account for this invisible work by layering tracking data and lineup metrics on top of box-score totals.
Tracking-based measures like contests, deflections, and loose-ball recoveries quantify hustle and effort that traditional stats ignore. Player tracking captures how many shots a defender contests, how close he is at the moment of release, how many times he deflects a pass or dribble, and how often he dives for loose balls. A wing who contests 12 three-point attempts and forces four misses on shots that typically convert at 38% provides measurable value even if he records zero steals or blocks. These metrics reward active hands, help rotations, and closeout discipline.
Matchup difficulty adjustments and rim-protection data contextualize defensive performance by accounting for the quality of the opponent’s offensive weapons and the player’s role in the scheme. A defender assigned to the opposing team’s best scorer while playing drop coverage on pick-and-rolls faces a harder task than a help-side weak-side defender who roams for steals. Rim-protection data isolates how often a big man is the closest defender to a shot at the rim and what percentage of those attempts he contests or alters. Defensive rating already adjusts for team context, but matchup difficulty and role-specific metrics ensure that a player’s grade reflects the true challenge of his assignment.
Contextual and Situational NBA Metrics for Accurate Grading

Pace, possession counts, and rest disadvantage shape the environment in which a player’s performance unfolds and determine whether raw totals or per-possession rates provide the clearer picture. A game played at 110 possessions per team generates more counting stats than one played at 95 possessions, so grading systems normalize by expressing outputs per 100 possessions to isolate efficiency from tempo. Rest disadvantage matters because players on the second night of a back-to-back or the third game in four nights typically show measurable declines in shooting accuracy, defensive intensity, and minutes played. A performance that looks mediocre in a vacuum becomes more impressive when the player is operating on short rest while the opponent is fresh.
| Context Factor | Why It Matters | Grade Effect |
|---|---|---|
| Pace (possessions per 48 minutes) | Higher pace inflates counting stats without changing efficiency | Use per-100-possession rates to compare across tempo environments |
| Rest disadvantage (back-to-back, travel) | Fatigue reduces shooting accuracy, defensive effort, and minutes availability | Boost grade for strong performance on short rest; penalize underperformance less |
| Opponent strength (offensive/defensive rating) | Elite defenses suppress efficiency; weak defenses inflate it | Adjust efficiency thresholds and impact metrics based on opponent quality |
| Lineup context (starters vs. bench units) | Backup units face weaker competition and different spacing/usage | Compare performance to role-specific benchmarks, not team-wide averages |
Opponent-strength and lineup-context adjustments prevent grading systems from rewarding stat accumulation against bad teams or penalizing players who face top-tier competition. Game-optimized EPM accounts for opponent defensive rating and home-court advantage under the hood, while manual grading workflows compare the player’s efficiency and impact metrics to his season averages against similar-caliber opponents. A 25-point game on 60% true shooting against the league’s best defense earns a higher grade than 30 points on 55% TS% against a tanking team’s bench lineup. Lineup context matters because a bench scorer facing second units operates in a different ecosystem than a starter battling elite defenders.
Role-Based and Positional Standards for Player Grading
Role and position shape expected outputs because a high-usage primary scorer is graded on different criteria than a low-usage defensive specialist or a stretch big whose value comes entirely from floor spacing and rim protection. A point guard who attempts 20 shots and posts a 22 PER might receive a middling grade if his role demands playmaking and he records only three assists, while a 3-and-D wing who scores 12 points on four three-point makes with strong defensive matchup coverage earns a higher mark despite the lower counting stats. Role-based grading aligns expectations with responsibility and prevents penalizing players for doing their job well within a limited offensive role.
Positional benchmark examples:
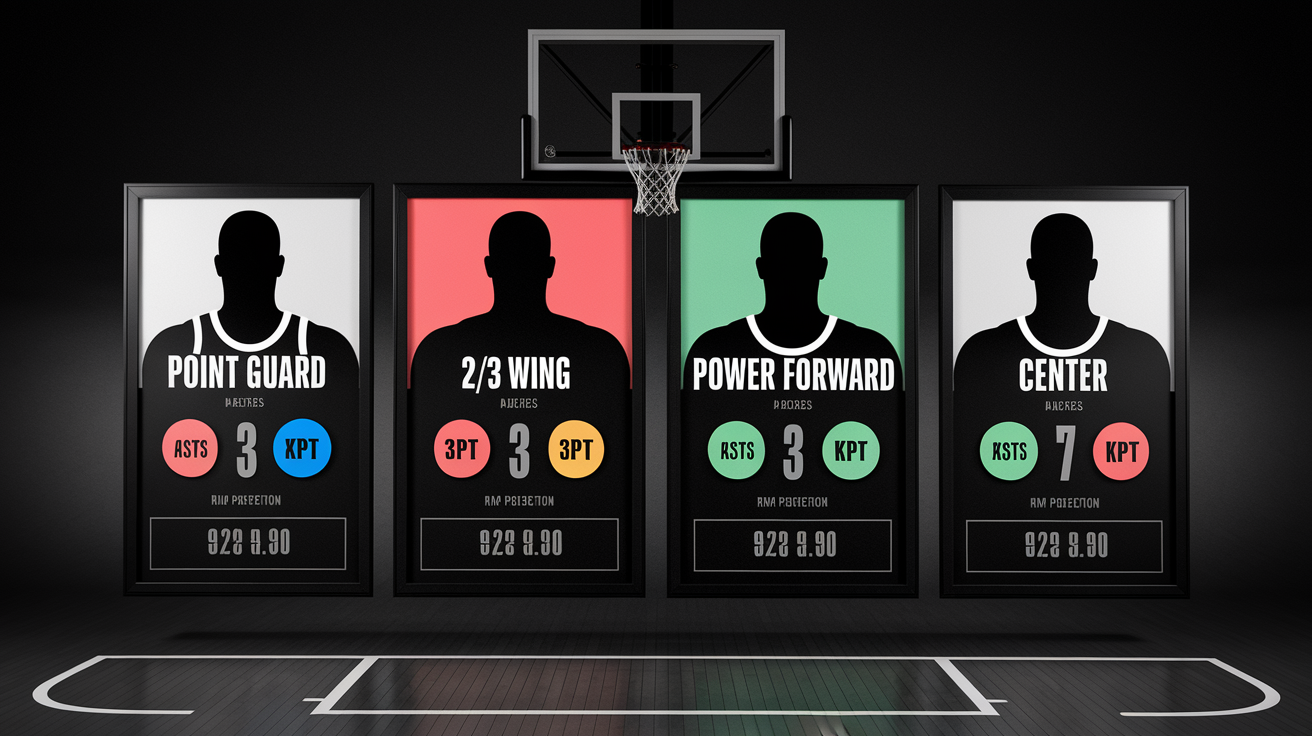
- Point guards are evaluated heavily on assist rate, assist-to-turnover ratio, on-ball creation, and defensive matchup against opposing ball handlers
- Wings (2/3) get graded on three-point shooting, defensive versatility, transition scoring, and ability to guard multiple positions
- Power forwards (4) are assessed on rebounding rate, corner-three efficiency, help defense, and offensive rebounding
- Centers (5) get judged on rim protection (contests, block rate), defensive rebounding, screen assists, and rim finishing percentage
Minute distribution and rotation context clarify whether a player’s production came during high-leverage minutes or extended garbage time. A reserve who posts strong per-minute numbers exclusively in blowout situations receives a lower grade than a starter who maintains efficiency while playing crunch-time possessions against the opponent’s best defenders. Rotation context also captures the substitution patterns that shape usage. A player who enters the game as the primary ball handler when the starter sits faces different expectations than one who shares the floor with multiple creators and operates as a spot-up shooter.
Visual Dashboards and Data Presentation for NBA Player Grades

Visuals strengthen clarity and credibility by transforming dense stat tables into intuitive graphics that communicate performance at a glance and support the narrative justification behind each grade. A well-designed dashboard pairs the final letter grade with a handful of essential metrics, comparison bars showing deviation from season averages, and spatial charts that illustrate shot selection and defensive positioning. These assets make advanced metrics accessible to casual fans while giving engaged readers the data depth to verify the grading logic and explore trends on their own.
Recommended visual assets for player grading:
- Shot charts and heat maps showing field goal attempts and makes by court zone, color-coded by efficiency to reveal shooting strengths and weaknesses
- On-off net rating graphs displaying team performance (points per 100 possessions scored minus allowed) with the player on versus off the court
- Radar charts plotting percentile ranks across six to eight key metrics (TS%, usage, assist rate, defensive rating, rebounding, turnovers) to create a visual performance fingerprint
- Metric percentile bars comparing the player’s game performance to his season average and league-wide position benchmarks
- Player dashboards consolidating 8 to 12 prioritized metrics (points, TS%, PER, plus-minus, usage, defensive rating, win shares, VORP) with season deltas and contextual notes in a single-screen view
Final Words
in the action: we laid out a clear 0–100 numeric grade with letter mapping, showed how context (pace, usage, matchup) tweaks raw scores, and broke down the advanced metrics and plus-minus tools that justify each mark.
We covered shooting quality, defensive tracking, role-based expectations, and how visuals make grades readable. Grades compare to season baselines and use stabilization for single-game volatility.
This gives you a repeatable way to read player grades and advanced metrics from nba games and make smarter lineup and conversation calls. You’re set to use the framework with more confidence.
FAQ
Q: What grading scale should I use for game-level player grades?
A: The 0–100 numeric grade structure is the recommended scale, mapped to letters: A 90–100, B 80–89, C 70–79, D 60–69, F under 60. Use both numeric score and letter.
Q: How should game context modify a player’s raw grade?
A: Game context modifies raw grades by adjusting for pace, role, matchup, usage, and lineup fit; weight those factors so high-usage mistakes or tough matchups don’t unfairly punish or inflate scores.
Q: What core factors should be included when grading a player?
A: Core grading factors are efficiency output, defensive impact, usage influence, playmaking responsibility, situational difficulty, and consistency versus expectations. Score each and blend into the final 0–100 grade.
Q: How do I compare a game grade to a player’s season averages?
A: Comparing a game grade to season averages means measuring deviation from a player’s baseline; big positive or negative gaps highlight real performance swings and should affect grade uplift or penalty.
Q: Which advanced metrics matter most for game-level grades?
A: The most useful advanced metrics for game grades include TS%, eFG%, PER, RPM, DRtg, and WS/48; each adds a different lens on efficiency, impact, defense, and overall value.
Q: Why use per-36 and per-100 possession stats in grading?
A: Per-36 and per-100 possession stats normalize minutes and pace, letting you compare players fairly when minutes or game speed differ, useful for bench players or fast-paced matchups.
Q: How should plus-minus and EPM influence player grades?
A: Plus-minus and EPM inform grades by showing on/off impact; RPM/BPM give lineup-adjusted signals, while EPM predicts value accounting for opponent strength and home-court effects.
Q: How do shooting efficiency and shot quality affect a player’s grade?
A: Shooting efficiency and shot quality affect grades by blending TS%/eFG% with shot-location data; rim finishing, corner threes, and free-throw rate show whether scoring was high-quality or volume-driven.
Q: How are defensive metrics applied to game-level grades?
A: Defensive metrics apply to grades via DRtg, defensive win shares, contest and deflection counts, rim-protection stats, and tracking data; adjust for matchup difficulty to avoid small-sample noise.
Q: How do role and position change grading expectations?
A: Role and position change grading expectations by setting different benchmarks: primary scorers need higher usage and TS%, 3-and-D players need efficient spacing and contests, rim protectors need paint defense impact.
Q: Which contextual adjustments should I make (pace, rest, opponent)?
A: Contextual adjustments like pace, possession counts, rest/back-to-backs, and opponent strength matter because they change raw outputs; factor them to avoid misgrading tired teams or fast-paced games.
Q: What visual assets should accompany player grades for clarity?
A: Visual dashboards should include shot charts, heat maps, percentile bars, radar charts, and on/off net rating graphs to make grades credible and easy to scan for fans and analysts.