

Think sportsbooks always price injuries right?
They’re often late.
Same-day injury and lineup updates create three money windows—early leaks, initial reports, final confirmations—and each one makes different edges.
When a starter is suddenly out or a backup’s minutes spike, spreads, totals, and props can lag by hours.
This piece shows you the simple, repeatable value plays to target: where to bet, why the market misprices it, and how to size wagers by confidence.
Read on to grab those short-lived edges before the books catch up.
Actionable Daily Value Plays Driven by Injury and Lineup News

Same-day injury and lineup updates consistently mess up betting markets. Sportsbooks and casual bettors don’t adjust their expectations at the same speed. When a star player’s status flips from questionable to out, the market either underreacts during the first wave or overreacts once public money piles onto one side. How injuries affect betting lines shows that key absences commonly shift spreads by 3 to 7 points in the NFL, 3 to 6 points in the NBA, and totals anywhere from 1.5 to 8 points depending on pace and usage. Those windows matter. Speculation leaks 48 to 72 hours before kickoff, initial reports drop within 24 hours, and confirmation locks in during the final 2 hours. Each window creates a different type of edge.
Markets underreact most often when a second-tier starter gets ruled out overnight. Or when a backup’s workload projection hasn’t been priced into player props yet. Backup usage changes can shift player-prop implied probability 20 to 40%, so a reserve guard who jumps from 12 minutes to 30 minutes may still be listed with odds that assume the lower workload. You gain value by identifying the correct replacement share before the market realizes it. Ticket versus handle splits help here. If 70% of tickets are on the favorite but only 55% of the handle is, the big money is going the other way. That signals sharps are fading the public overreaction or positioning against a square-heavy line.
When building daily value plays, confidence tiers become essential. High-confidence wagers (0.75 to 1.5 units) belong on confirmed absences with clear role replacements. Medium bets (0.25 to 0.75 units) fit probable downgrades or defensive-injury scenarios. Low stakes (0.1 to 0.25 units) handle last-minute scratches with small sample data. These structured approaches keep variance in check and let you scale up when edges are largest.
Daily value play categories include:
Star out, spread not fully adjusted. When a starting quarterback or lead scorer is ruled out and the spread moves only 2 to 3 points instead of the expected 5 to 7, the opponent or adjusted team total becomes a value target.
Backup minutes spike props. Reserves who inherit 25+ minutes often see prop lines that lag actual expected production by 15 to 30%, especially in the first game after a starter is confirmed out.
Team totals versus replacement usage rate. If a team loses its primary offensive hub and projected team points drop by 5 but the posted total drops only 3, betting under that team’s adjusted total offers value.
Underreaction to defensive injuries. Loss of a top pass rusher or rim protector can increase opponent scoring by 3 to 6 points, yet totals sometimes move only 1 to 2 points initially, leaving the over mispriced.
Late scratch opportunities within 90 minutes. Players ruled out in the final hour often force sharp line moves, but slower books hold stale numbers for 5 to 15 minutes, creating short-term arbitrage windows.
How Injury Reports Create Daily Sports Betting Value Opportunities

Practice participation and game-status designations directly influence how sportsbooks price spreads, totals, and props. Questionable status typically means a roughly 50/50 chance of playing, doubtful signals unlikely to suit up, and out is definitive. Final game-status reports drop Friday for Sunday NFL games and Saturday for Monday games, giving bettors a narrow confirmation window before kickoff. Market sensitivity varies by role and sport. Quarterback injuries shift spreads 3 to 7 points, elite NBA scorers produce 3 to 6 point moves, and rotational players rarely change lines more than 1.5 points. Understanding which tiers of players produce which tiers of movement helps separate signal from noise.
Sportsbooks differ in how quickly they respond to new information. Some books move lines immediately after initial reports, others wait for confirmation and public action. That delay creates short-term mispricings. If one book moves 3 points on a probable-out quarterback and another moves only 1.5, the slower shop offers temporary value until it catches up. Monitoring multiple outs lets you identify and exploit these timing gaps before the entire market settles on a consensus number.
| Status | Typical Market Reaction | Value Opportunity |
|---|---|---|
| Questionable | Line moves 1 to 2 points as market hedges uncertainty | Wait for confirmation; value emerges once status becomes definitive |
| Doubtful | Line moves 2 to 4 points as probability of absence rises above 75% | Consider early wager if you project full-out impact will push line further |
| Out | Full impact priced: 3 to 7 points (QB), 3 to 6 (NBA star), 1 to 3 (role player) | Shop slower books that haven’t adjusted or find props on backups not yet corrected |
| Limited practice | Small early move; wait for Friday/Saturday status | Track historical performance after limited sessions; fade overreaction if player has played through similar all season |
Daily Line Movement Patterns and Market Reaction to Lineup News
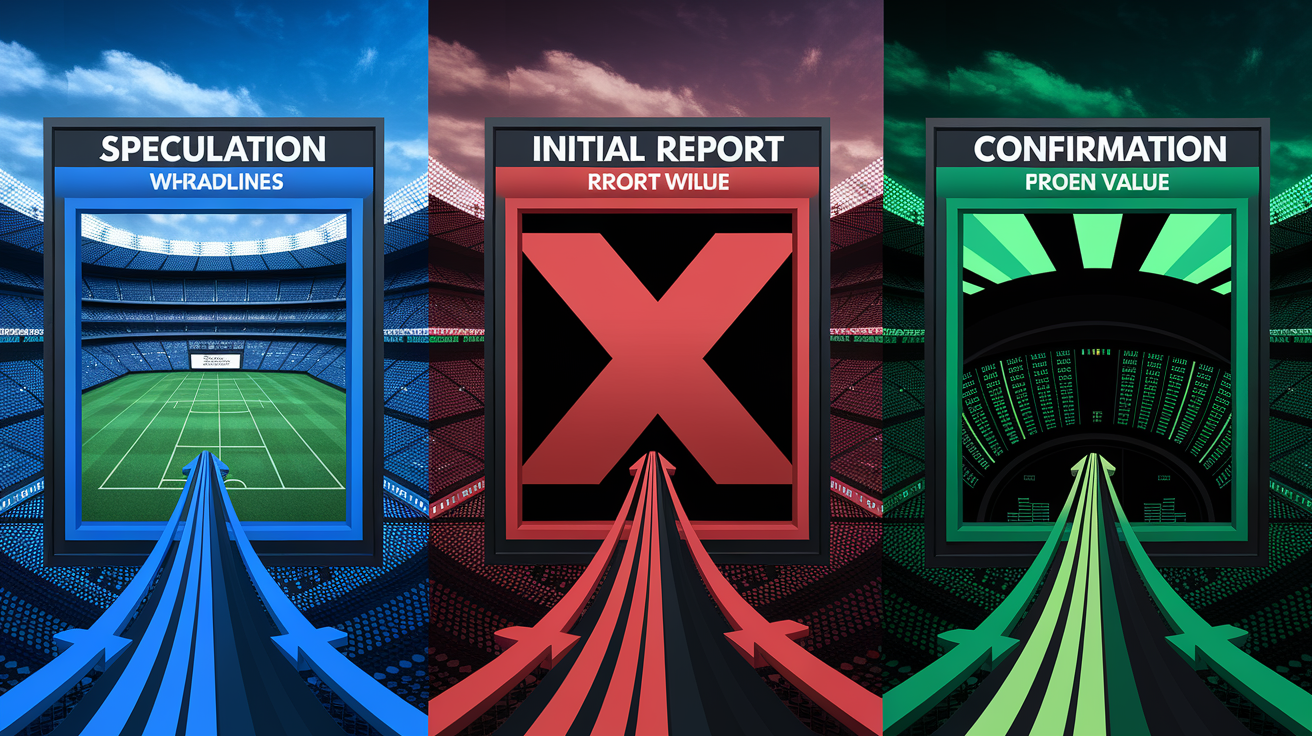
Three distinct windows shape daily line movement. The speculation window opens 48 to 72 hours before kickoff when beat reporters hint at injuries or rest days, pushing early lines 1 to 3 points as bettors anticipate official news. The initial report window lands within 24 hours of game time, usually triggered by mandatory injury reports. Here lines can jump 3 to 5 points once a star’s absence gains traction. The confirmation window occurs in the final 2 hours, when inactive lists lock in and sharp money moves decisively. Each phase offers different edges. The first window rewards early projection, the second tests your speed reading reports, and the third demands quick execution before stale numbers vanish.
Ticket versus handle splits reveal whether movement is driven by recreational volume or sharp positioning. A line that sees 70% of tickets on the favorite but only 55% of the handle means thousands of small public bets are pushing one way while a few large wagers lean the other direction. If that line hasn’t moved much, the book is respecting the sharp side and fading the public. If the line has moved hard toward the favorite despite the handle split, the public weight is forcing the bookmaker to shade risk. Comparing the direction and magnitude of movement against these splits tells you whether the current price reflects true probability or crowd bias.
Identifying overreaction versus underreaction requires comparing posted spreads and totals to typical injury-based expectation ranges. When a starting NFL quarterback is ruled out and the spread moves 6.5 points, that’s in line with historical norms. When it moves only 3, the market is underpricing the backup downgrade. When an NBA team loses its leading scorer and the total drops 4 points but your usage-rate projection expects a 7-point drop, the under holds value. Divergent sportsbook movement also signals stale numbers. If four books have moved to -7.5 but one still sits at -5, that laggard offers temporary value until it syncs with the consensus.
Identifying Daily Value Plays Across Multiple Sports Using Injury and Rotation Shifts
Different sports create unique daily edges tied to absences because substitution patterns and workload distribution vary widely. NBA rotations are tight. Eight players handle 90% of minutes, so a star’s absence forces steep usage increases on backups who inherit scoring, assists, and rebounding volume. When a 30-point-per-game scorer sits, his replacement rarely delivers 30, but role players around him see 5 to 10% usage bumps that shift their player-prop lines by 20 to 40%. Those props often lag for hours after the initial news because books focus first on spreads and totals. Betting the over on a backup guard’s points or assists within that lag window captures value before the market catches up.
Teams with weak positional depth produce larger edges because replacement quality drops faster. If a roster loses its starting point guard and the backup is a rookie with limited offensive responsibility, opponent defenses can load up elsewhere, magnifying the net scoring drop. Conversely, teams with veteran depth experience smaller swings, so a backup who’s a former starter only causes a 1 to 2 point spread shift. Scouting depth charts in advance lets you predict which absences will move lines 5+ points and which will move 2 or fewer, allowing you to target mispriced markets when books underestimate or overestimate backup impact.
Translating replacement minutes or workload into value plays requires calculating expected production changes. Start with the injured player’s usage percentage and minutes share, then estimate how those minutes redistribute. If a star played 36 minutes and logged 28% usage, and two backups split those minutes evenly at 18 each, you can project their combined usage bump by multiplying their historical per-minute rates by the new workload. Compare your projection to posted props. If your math says the backup should hit 15 points and his over/under sits at 11.5, the over offers clear value. Apply the same logic to team totals. If a team’s projected points drop matches or exceeds the posted total adjustment, the under becomes profitable.
Cross-Sport Injury Impact Comparisons
NFL quarterback sensitivity creates the largest single-player spread swings, 3 to 7 points, because backup signal-callers rarely replicate starter efficiency in read progressions, deep-ball accuracy, or pre-snap adjustments. NBA usage dependency runs nearly as high. A 30-usage% scorer who’s ruled out forces 30% of possessions onto teammates, often causing pace slowdowns and efficiency drops that shift spreads 3 to 6 points and totals 5 to 8 points in extreme cases. MLB bullpen depletion produces delayed value. When a starting pitcher exits early or a closer lands on the IL, bullpen usage rates spike over the next three games, increasing opponent run totals by 1 to 2 runs per game as fatigue and lower-leverage arms take innings. NHL defensive injuries have a subtler but real ripple. Losing a top-pairing defenseman can cost 3 to 5 minutes of ice time to shutdown duties, pushing totals up 0.5 to 1.5 goals as the replacement struggles in high-danger areas.
Expected Value and Probability Adjustments for Injury-Based Betting Picks

When a key player is ruled out, betting models need to recalibrate usage percentages, minutes distributions, and expected points added. Injury tools quantify win-probability decreases. Baseball models might show a −2.4% change when an elite shortstop sits, hockey projections a −1.5% shift for a top defenseman. Those percentage-point swings translate into spread and total adjustments. A quarterback ruled out commonly produces a 3 to 7 point spread change because his EPA per play and red-zone conversion rate drop sharply under a backup. Totals can shift by 1 to 8 points depending on whether the absence affects offense, defense, pace, or all three. Recalibrating your own projections to match these ranges ensures you’re not betting outdated assumptions.
Calculating expected value for injury-driven picks starts with converting updated win probabilities into implied odds and comparing them to posted prices. If your model says the favorite should be -180 after losing a star but the book still offers -150, the implied probability gap represents positive EV. Multiply that edge by your unit size and expected sample frequency to estimate long-run profit. Do the same for totals. If your adjusted projection is 215.5 and the posted total is 218, betting under at standard -110 juice offers value when your model’s confidence interval sits well below the number.
Key probability adjustments include:
Adjusting usage and minutes. Multiply the injured player’s usage rate and minutes by zero, then redistribute that share proportionally to backups and role players based on historical rotation patterns when the starter was previously absent.
Translating absence into expected points change. Sum the injured player’s points per game, subtract the backup’s projected replacement production, and apply that net difference to team totals and spreads.
Estimating spread and total equivalents. Each 1% win-probability change in a coin-flip game equals roughly 0.5 points on the spread; each 3 to 5 points of expected team scoring change moves totals by the same amount.
Applying EV formulas for price evaluation. EV = (Win probability × Payout) − (Loss probability × Stake). Positive EV means bet; negative means pass or find a better number elsewhere.
Bankroll Management and Unit Sizing for Daily Injury-Driven Value Plays

Late scratches increase variance because confirmation windows shrink to minutes, leaving less time for market consensus and more room for information asymmetry. When a player is ruled out 90 minutes before tip-off, some bettors miss the update entirely, others react emotionally, and sharp action floods the best remaining prices. That volatility means your edge may be real but short-lived, and swings around the closing number can be wide. Sharp recommendations suggest capping any single injury-driven play at roughly 1.5 units maximum, even when confidence is high, to avoid overexposure to correlated outcomes that all hinge on one late-breaking piece of news.
Managing correlated outcomes becomes critical when multiple bets share the same root cause. If you bet the under on a team’s total, the opponent’s spread, and a backup’s points prop, all three wagers succeed or fail together if the injury plays out as expected or doesn’t. Clustering 4 to 5 units across correlated plays on a single slate magnifies risk because one incorrect read, say, the backup plays better than projected, sinks all positions at once. Instead, limit total correlated exposure to 5 to 6 units per day and diversify across independent games or uncorrelated prop categories to smooth variance.
Scaling up or down based on model confidence keeps unit sizing rational. High-confidence plays, where your projection sits multiple standard deviations from the market price and historical injury data backs your estimate, justify 1.0 to 1.5 units. Medium-confidence scenarios, such as probable downgrades or defensive-injury impacts with wider outcome ranges, fit 0.25 to 0.75 units. Low-confidence late-breaking news with minimal sample data deserves 0.1 to 0.25 units. You’re taking a calculated shot, but you’re not risking meaningful bankroll on a guess. Track results by confidence tier over 50 to 100 plays to verify your edge holds and adjust tier definitions if variance exceeds expectations.
Daily Checklist for Evaluating Value Plays from Injury and Lineup News

Confirm official status within 2 hours of game time. Check team injury reports, beat reporters, and official inactive lists to ensure the player is definitively out or in before placing your wager.
Compare market reaction across 3 to 5 sportsbooks. Identify which books moved lines aggressively and which are holding stale numbers; price discrepancies of 1 to 2 points signal value opportunities on the slower shops.
Check ticket versus handle splits. Use publicly available betting percentages to see if the line movement reflects small public action or large sharp wagers; divergence between tickets and dollars reveals where the smart money is positioned.
Validate pace and usage projections. Calculate expected minutes and usage redistribution for backups, then compare your projected team points or player props to posted lines; gaps of 10%+ implied probability indicate value.
Monitor final lineup locks 30 to 60 minutes before start. Lineups can change due to warmup issues or coach decisions; re-check status right before the game to avoid betting on outdated information.
Look for vig variance above -110. If juice climbs to -120 or worse on your target side, the effective price worsens and erodes value; shop for lower holds or reconsider the wager.
Shop lines across multiple books for best price. Half-point differences on spreads and totals compound over dozens of bets; always take the most favorable number available at the moment you’re ready to commit.
Log every play with status, odds, result, and profit/loss. Track outcomes by injury type, market reaction size, and confidence tier to build a statistically valid sample and refine your process over time.
Final Words
In the action, injuries and late lineup news are where quick bettors find edges, and this guide mapped the three market windows (48-72 hours, 24 hours, last 2 hours), typical spread/total swings, and common underreactions.
We showed how to turn reports into expected value, how to size 0.25–1.5 unit plays, and when to tighten bankroll or fade correlated bets.
Use the checklist, shop lines, and monitor ticket vs handle splits. Daily sports betting value plays based on injury and lineup news are repeatable if you act fast and manage units. Stay sharp. There’s value every slate.
FAQ
Q: What is the 1 3 2 6 strategy?
A: The 1-3-2-6 strategy is a four-bet staking plan that locks profits after consecutive wins: wager 1 unit, then 3, then 2, then 6, restarting after a loss or the finished sequence.
Q: Has anyone hit a 25-leg parlay?
A: A 25-leg parlay has been hit, but it’s extremely rare; there are public reports of such one-off wins, and sportsbooks rarely fully verify every claimed winner.
Q: What is statistically the best sport to bet on?
A: The statistically best sport to bet on depends on your edge and market inefficiency; MLB and lower-division soccer often show more exploitable matchups, while NFL/NBA lines are usually tighter.
Q: Who bet $100 to win 1.7 million?
A: The person who bet $100 to win $1.7 million reportedly did so with a massive long-shot parlay; names and verification vary by report, so check the original news source for who it was.