

Want a quick edge this weekend?
Here’s a hard number: outright Wild Card winners covered the spread 69-10-1 over the last 80 games, about 87%.
Translation: if you’re tempted by the moneyline, the spread often gives cleaner value.
Totals at 44 and up have leaned Under, and early line movement plus public vs money splits show where the pros are.
Read on for the exact signals to watch and how to turn them into smart, actionable wagers before lines lock.
Key Weekend NFL Betting Trends Delivering Immediate Actionable Edges

Outright winners in NFL Wild Card playoff history have covered 69-10-1 ATS over the last 80 games. That’s 87.3%, and it tells you something pretty simple: when a team wins, they usually beat the spread too. So if you’re leaning toward a team on the moneyline, the spread’s probably the smarter play. And if the spread looks sketchy? There’s often moneyline value sitting with the dog.
Totals at 44 or higher lean Under hard. We’re talking 32-15-1 in the last 43 Wild Card games, good for 68.1%. As of midweek January 7, 2026, every game except Houston-Pittsburgh is sitting at 44.5 or above. That makes the Under your baseline unless something major (weather, injuries, pace) flips the script.
Public betting percentages and money percentages split when sharp bettors load up. Here’s the rule: if there’s a gap bigger than 20 percentage points between how many bets are placed and where the actual money’s going, or if the crowd’s hammering one side but the cash is flowing the other way, you’re seeing professional action. When public betting hits 75% or more on one side, that’s “overwhelming” territory. If the line isn’t moving toward that crowd? Consider fading it.
Weekend edges you can use right now:
- Line movement – Rams opened at -10.5, Bills at -1.5, Texans at -3. Any shift of 1.5+ points in 24 to 72 hours? That’s sharp money talking.
- Seed edges – #4 seeds are 24-12-2 ATS (66.7%). But #3 seeds favored by less than 3.5? Just 2-15 ATS since 2004.
- Totals ranges – Games decided by 3 points or less run Under 22-11-1 (66.7%). Totals at 40 or below have gone Over 8 of the last 11.
- Public thresholds – If 75%+ of bets are on one side and the line isn’t budging toward them, you’ve got a fade candidate.
- Scoring benchmarks – Home teams that score 21+ go 75.4% ATS. Road teams under 20 points? 7-49 ATS. That’s brutal.
- Consensus checks – Compare spreads at four books minimum. Half a point can be the difference between cashing and losing.
Weekend NFL Line Movement Patterns and Market Behavior Bettors Must Track

When a line shifts 1.5 points or more in the first 24 to 72 hours after opening, that’s sharp action. Especially if there’s no injury news attached. Movement of 3 points or more? You need confirmation that real money, not just volume, is driving it. Thursday and early Friday lines show you market equilibrium. Late Friday and Saturday moves are usually retail bettors piling onto favorites and overs, which is why getting in early often gives you better value.
Overnight line moves without news are classic sharp tells. You wake up Friday and a spread jumped a full point with no press conference or injury update? Institutional money moved it. Moneyline shifts of 10 to 20 cents early in the week carry the same weight. Odds compilers are reacting to informed bets, not public guesses.
Close spreads between +3 and -3 have gone Under 22-11-1 (66.7%) in recent Wild Card rounds. That makes any tight matchup with a total near or above 44 a strong Under candidate. Totals that creep upward late in the week, pushed by public Over money, often give you the best contrarian Under value if the opening number was already high. Watch where your target games sit relative to that 44-point threshold and whether movement’s coming from ticket count or actual handle.
| Movement Type | Threshold | Action to Take |
|---|---|---|
| Early sharp move | ≥1.5 points, first 24–48 hours | Follow the line; informed money’s usually right |
| Late public push | Friday night / Saturday, ≥1 point | Fade it if the line was already sitting on a key number |
| Moneyline drift | 10–20 cents within 24 hours | Check for a matching spread move; signals value shift |
| Totals creep upward | Opening ≤43.5, closing ≥45 | Consider Under if public Over % hits ≥70% |
| Reverse line movement | Line moves opposite to ≥65% public bet % | Strong sharp signal; prioritize that side |
Weekend NFL Public vs Sharp Betting Splits and How to Read Them

Bet percentage counts tickets. Every $10 wager gets counted the same as every $10,000 wager. Money percentage, also called handle, weights bets by size. That gives you a clearer picture of where the serious money’s going. When 65% of tickets are on Team A but 55% of the money’s on Team B, larger bets (typically from sharps) are backing Team B, even though more individual bettors picked Team A.
A gap bigger than 20 percentage points between ticket count and handle is the clearest signal of sharp action. If 70% of tickets are on the favorite but only 48% of the money is, pros are hammering the underdog with bigger wagers. The reverse (high money percentage, lower ticket count) means fewer bettors are placing bigger, more confident bets. Last season, sharps finished 14-8 while the public went 8-14. Following money percentage in divergent situations pays.
When public betting hits 75% or more on one side, that’s overwhelming. And it becomes a fade candidate when the line either holds or moves against the public. If three quarters of all bets are on the Chiefs at -7 but the line drops to -6.5, the sportsbook’s protecting itself against sharp money on the underdog. That’s your cue. But if public and sharp money align (both percentages above 65% on the same side), the play often has genuine two-way value. Fading becomes riskier.
How to filter and act on these splits:
- Bet % vs Money % – A gap over 20 points or opposing directions flags sharp disagreement with the public.
- Fade the public – When 75%+ of bets land on one side but the line doesn’t move that direction, bet the other side.
- Follow sharp signals – Money % significantly higher than bet % on an underdog? That’s a green light for contrarian value.
- Filter low-handle games – Total handle under roughly $1,000 makes percentage gaps unreliable. Skip or downgrade the signal.
- Sportsbook liability pressure – Books sometimes shade lines to balance action on heavily bet games. Check if the move’s protecting the house or reflecting true sharp opinion.
Weekend NFL Weather and Injury Impacts on Spreads and Totals

Wind at 20 mph or higher cuts projected totals by 3 to 5 points because deep passing gets inconsistent and kickers lose range. Heavy rain or sleet drops totals 4 to 7 points as ball security falls apart and offenses shift to conservative, clock-eating run schemes. When forecasts at kickoff show precipitation probability above 60% or sustained winds in the 15 to 19 mph range, trim your total expectation by 1 to 2 points and lean Under unless the line’s already dropped to account for conditions.
Missing a starting quarterback swings the spread 4 to 8 points depending on backup experience, with the bigger adjustment saved for playoff or high-stakes games where scheme familiarity matters. A questionable QB with limited practice participation typically moves the line 2 to 4 points. Offensive line injuries (especially at left or right tackle) reduce pass protection, increasing opponent sack rates and cutting projected passing yards by 10 to 18%. When a top running back or wide receiver’s ruled out, expect team scoring to drop 6 to 12%. That translates to roughly 1.5 to 3 points off the spread or total.
Injury Impact Rules for Side and Total Betting
Quantify each injury by position and role. A backup quarterback making his first playoff start against an above-average pass rush should move your spread estimate 6 to 8 points toward the opponent. If the injury report shows a starting left tackle downgraded from full to limited participation on Friday, model a 12 to 15% reduction in pass-play efficiency and adjust your total down 2 to 3 points. Missing a bell-cow running back shifts rushing share to a committee, increasing play-call variance and reducing red-zone efficiency. Subtract 1.5 to 2.5 points from the team total and lean Under if the opponent’s run defense is above league average.
Weather amplifies injury effects. A backup quarterback facing 22 mph winds and a top-10 pass rush creates a compounding scenario. Expect conservative play-calling, shorter routes, and a significant scoring reduction. Use the injury-weather combination to justify larger total moves: if rain and a missing QB both apply, stack the 4-point rain adjustment with the 4-point QB downgrade for an 8-point total revision, then compare that to the posted line. When offensive line injuries coincide with poor weather, rushing share typically jumps 6 to 10 percentage points, favoring Unders and making team totals more volatile but generally lower.
Weekend NFL Totals Trends: Over/Under Patterns Worth Targeting
Totals at 44 or higher have closed Under 32-15-1 in the last 43 Wild Card games. That’s 68.1%, and it reflects playoff defensive intensity plus conservative game-planning. As of midweek January 7, 2026, every Wild Card matchup except Houston-Pittsburgh carries a total of 44.5 or above. That puts nearly the entire weekend slate into historically Under-leaning territory. Compare each game’s projected pace and efficiency to the market number. If your model shows a combined expected score 6 or more points below the posted total, the Under becomes high confidence.
Saturday Wild Card games have gone Over 20-16-1 (55.6%), slightly favoring the Over. Sunday games have hit Under 29 of the last 42 times (69%). That day-of-week split matters when you’re deciding between two similar totals. Monday Night Football playoff hosts since 2022 are 4-1 to the Over. Small sample, but relevant when you’re evaluating the Steelers-Texans total. Closing totals at or below 40 have gone Over 8 of the last 11 times, likely because low totals invite sharp Over money when offenses are undervalued.
Road teams that win outright have driven Unders 24-8-2 (75%) in a 14-year sample. That suggests when an underdog pulls the upset, the game script often features ball control, turnovers, and clock management rather than shootout scoring. If you’re betting a road underdog moneyline or spread, pairing it with the Under creates a correlated hedge that pays when the dog keeps the game slow and methodical.
| Total Range | Historical Result | Weekend Application |
|---|---|---|
| ≥44 points | Under 32-15-1 (68.1%) | Lean Under on all games at 44.5+; wait for weather/injury confirmation |
| ≤40 points | Over 8-11 (last 11 games) | If Houston-Pittsburgh closes ≤40, consider Over; sharp money often finds value |
| Close spreads (±3) | Under 22-11-1 (66.7%) | Stack Under with tight-line games; playoff intensity limits scoring variance |
| Saturday totals | Over 20-16-1 (55.6%) | Slight Over lean; check if home team has pace advantage before betting |
Weekend NFL ATS Patterns and Team/Matchup Edges

Home teams that score 21 or more points in Wild Card games are 59-7 straight up and 49-16-1 ATS. That’s a 75.4% cover rate, making 21 the magic number for home favorites. If your model projects the home team to reach 21 based on matchup efficiency and opponent defensive metrics, the spread becomes safer even if the line’s inflated. Road teams scoring fewer than 20 points have gone 7-49 ATS (12.5%) since 2002. Road underdogs need to crack 20 to have any realistic shot at covering or winning outright.
Saturday home teams in the last 39 Wild Card games are 25-13-1 ATS (65.8%). Sunday hosts? Just 15-26-1 ATS (36.6%). That’s a 29-point swing in cover rate based solely on the day of the week, likely driven by rest patterns, travel schedules, and the types of matchups slotted for each day. If you’re choosing between two similar home favorites, the Saturday game offers better historical ATS value. Monday Night Football playoff hosts are 4-1 ATS since the format began in 2022. Another small but relevant edge.
Seed-based trends show #4 seeds covering 24-12-2 ATS (66.7%) over the last 19 seasons. AFC #4 seeds are even stronger at 14-6 ATS (70%). #3 seeds that are underdogs or favored by fewer than 3.5 points have gone just 2-15 straight up and ATS (12.5%) since 2004, averaging only 17.4 points per game in those spots. When a #3 seed isn’t commanding respect from the market, history says fade them hard.
Teams that rush for more yards than their opponent are 26-8 ATS (76.5%) over the last six Wild Card seasons. Teams that win time of possession are 21-8 ATS (72.4%). Both stats reflect game control and conservative leads, which correlate strongly with cover rates in playoff football. Offensive yards per pass attempt has proven even more predictive: teams with higher YPA in Wild Card games are 51-14-1 ATS (75.6%) since 2012, making passing efficiency the single most reliable in-game stat for ATS outcomes.
Weekend NFL Player Prop Trends and Usage-Based Edges

When a starting running back or number-one wide receiver gets ruled out, the team’s projected scoring drops 6 to 12%. That translates directly to lower yardage and touchdown props for the offense. If the backup has limited playoff experience or the offense lacks a clear secondary option, prop totals on the remaining skill players often stay too high because the market assumes volume will simply shift. Target Unders on quarterback passing yards and team totals when a top pass-catcher’s missing, especially if the opponent’s secondary is above average.
Offensive line injuries reduce pass protection, cutting expected passing yards by 10 to 18% and increasing sack props for the opposing defense. When weather conditions add wind at 20 mph or higher, rushing share jumps 6 to 10 percentage points. That makes running back yardage props and rushing attempt Overs more valuable. Pair weather-driven rushing increases with teams that already rank in the top ten for rush rate, and avoid quarterback passing Overs in those matchups unless the line’s already been adjusted downward by the market.
Efficiency metrics like yards per attempt predict prop success better than raw volume stats. A quarterback with a regular-season YPA edge of 0.5 or more over his opponent is far more likely to hit his passing-yard Over, even if his team runs the ball more frequently, because each attempt generates more yardage. Red-zone target share and snap-count trends from the final three weeks of the regular season often carry into the playoffs. A tight end who saw 25% of red-zone targets in Weeks 15 to 17 becomes a strong anytime-touchdown candidate if that role hasn’t changed.
| Prop Type | Key Metric | Weekend Application |
|---|---|---|
| QB passing yards | YPA edge ≥0.5 vs opponent | Bet Over if weather’s neutral and OL is healthy; avoid if winds ≥20 mph |
| RB rushing yards | Weather-driven rush share +6–10% | Target Overs in rain/wind games for bell-cow backs; fade committees |
| WR/TE receiving yards | Red-zone target % last 3 weeks | Bet Overs on players with ≥20% RZ share if QB’s healthy and line’s under 60 yards |
| Anytime TD scorer | Snap count % ≥70% + goal-line role | Prioritize RBs and TEs with exclusive goal-line work; avoid TD props on injured skill players |
| Sack props (defense) | OL injuries reducing pass protection | Bet sack Overs when starting LT/RT is out and opponent pass rush ranks top 12 |
Weekend NFL Predictive Metrics: YPA, Third Down, and Scoring Defense Insights
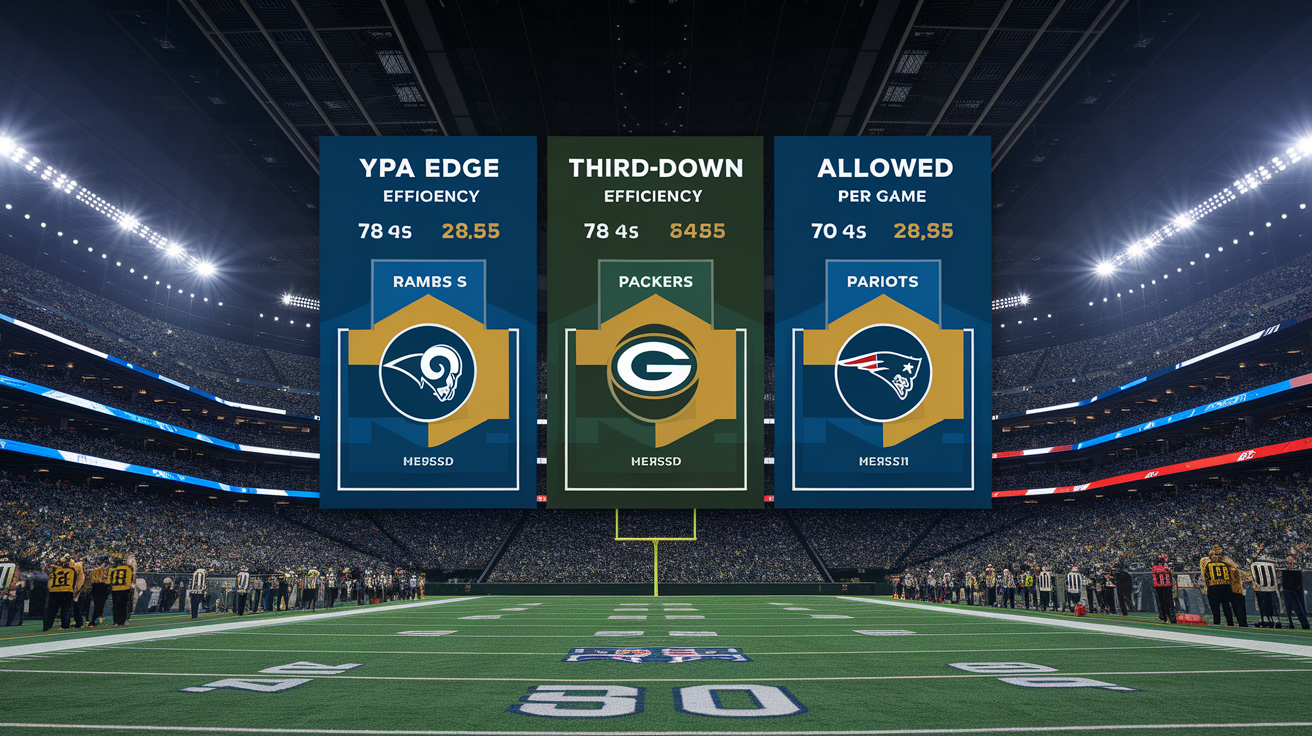
The highest-return betting system identified across the last 14 Wild Card seasons combines three regular-season edges: offensive yards per attempt, offensive third-down conversion rate, and points allowed per game. Teams that held all three advantages (higher YPA, better third-down offense, and lower opponent scoring) went 18-6 ATS (75%) in playoff games since 2010. For the 2026 Wild Card weekend, the Rams, Packers, and Patriots meet all three criteria, making them the statistically strongest ATS plays regardless of seed or home-field status.
Offensive efficiency outpredicts volume. Teams with higher YPA are 51-14-1 ATS (75.6%) in Wild Card games since 2012, while teams with more total passing yards are just 18-24 ATS (42.9%) since 2018. The difference is clear: explosive plays and per-attempt efficiency win playoff games, while high yardage totals often reflect garbage time or losing game scripts. When you’re building a weekend card, prioritize YPA gaps over passing-yardage gaps, and stack YPA edges with third-down offense, which has gone 20-10 ATS (66.7%) since playoff expansion.
Defensive metrics that matter most are scoring defense and yards per play allowed. Teams allowing fewer points per game are 20-10 ATS (66.7%) over the last five Wild Card seasons. Teams with better defensive yards per play are 21-9 ATS (70%) since 2021. Forced turnovers and defensive third-down stops, by contrast, have been unreliable: teams forcing more turnovers went just 16-26 ATS (38.1%) since 2017, and third-down defensive edges are 13-25 ATS (34.2%) since 2019. Focus on preventing points and limiting explosive plays, not on takeaway variance.
Core efficiency edges to apply this weekend:
- First-down advantage – Teams with more first downs are 41-13-1 ATS (70.7%) in the last 11 seasons.
- Time of possession – Winning the clock battle correlates with 21-8 ATS (72.4%) covers.
- Rushing-yardage edge – 26-8 ATS (76.5%) over the last six Wild Card weekends when one team rushes for significantly more.
- Fewer turnovers – Teams committing fewer turnovers are 28-8 ATS (77.8%) since 2015. Turnover margin remains king in playoff football.
Weekend NFL Bankroll and Bet-Timing Guidelines

Lock in early value Thursday evening or Friday morning when sharp bettors first move lines, then re-check all positions Saturday morning and again within 90 to 120 minutes of kickoff. The final two-hour window before game time reveals late injury clarity, sharp money adjustments, and public overreactions, often creating the weekend’s best closing line value. If a line’s moved 1.5 points or more in your favor since you first identified the edge, consider adding to the position. If it’s moved against you by the same margin without corresponding news, re-evaluate whether your initial read still holds.
Line shopping across at least four sportsbooks is non-negotiable for weekend NFL betting. A half-point difference on the spread (getting -2.5 instead of -3, or +7 instead of +6.5) swings your win rate by several percentage points over a full season. Moneyline value of 5 to 10 cents (moving from -110 to -105, for example) adds up across dozens of bets and directly improves your return on investment. Use odds-aggregation tools to compare spreads, totals, and moneylines in real time, and always take the best available number even if it requires opening an account at a new book.
Avoid chasing large edges with oversized units. Small edges of 0.5 to 1.5 points should carry standard unit sizing and require at least one confirming signal: public lean opposite your side, sharp line movement in your direction, or a key injury favoring your position. Medium edges of 2 to 3.5 points justify 1.5 to 2 units only when backed by two of the following: measurable sharp action, a significant injury to the opponent, or adverse weather that specifically harms the other side’s strengths. Never increase your weekend stake based solely on confidence or recent win streaks. Let the quantitative edge and the number of confirming signals determine your size, and preserve bankroll for the Divisional Round when sharper lines and tighter markets reward disciplined positioning.
Final Words
In the action: you now have quick rules to spot edges, ATS tendencies that favor outright winners, totals that lean Under at 44+, and line-move signals that suggest sharp money.
Use the >20% public-vs-money gap, watch early Thursday/Friday moves, and respect weather and injury swings when a QB or OL is out.
Run your checklist, size bets to bankroll guidance, and line-shop. These weekend nfl betting trends to watch should leave you sharper and ready, headed into the slate with more confidence.
FAQ
Q: What are the top weekend NFL betting trends to target?
A: The top weekend NFL betting trends to target are ATS edges (outright winners often cover), totals behavior around 44, sharp/public splits (>20% gap), notable seed performance, and closing-line movement checks.
Q: How do ATS winners affect moneyline and spread decisions?
A: ATS winners affect moneyline and spread decisions because outright winners covered 69-10-1 ATS in the last 80 wild-card games, so favor teams showing both win probability and cover history.
Q: Why do totals of 44 or higher lean Under and how should I use that?
A: Totals of 44 or higher lean Under—historically Under 32-15-1—so compare current weekend totals to weather, injuries, and market movement before siding with the Under.
Q: How do I detect sharp action using public percentage versus money percentage?
A: You detect sharp action using public vs money by watching for >20% bet/money gaps and treating ≥75% public tickets as overwhelming; big money shifts with lower ticket share usually signal sharps.
Q: What line-movement thresholds indicate sharp money versus retail noise?
A: Line-movement thresholds indicating sharps are moves ≥1.5 points in 24–72 hours; ≥3 points usually need pro-money confirmation; overnight moves without news and early ML shifts of 10–20 cents also flag sharp action.
Q: Which opening vs closing line movements should I watch this weekend?
A: Watch notable opening-to-closing swings like Rams -10.5, Bills -1.5, Texans -3 and any late closes that flip the edge—big drift toward one side often highlights sharp money or public overload.
Q: How should weather and injuries change my spread and totals decisions?
A: Weather and injuries should change bets numerically: wind ≥20 mph trims totals 3–5 points, heavy rain 4–7, missing QB swings spreads 4–8 points, offensive-line damage cuts pass yards 10–18% and boosts rushing share.
Q: What totals trends by day and range are most actionable?
A: Totals trends show Sunday games lean Under (29-42, 69%), Saturday slightly Over (20-16-1), closing totals ≤40 often hit Over (8 of last 11), and road-team wins correlate with Under (24-8-2).
Q: Which ATS team and seed edges should bettors prioritize?
A: Prioritize seeds and situations with proven ATS returns: #4 seeds 24-12-2 ATS, small #3 favorites struggle (2-15 ATS), home teams scoring 21+ hit ATS heavily, and rushing-yard advantages predict covers.
Q: How can I exploit player prop trends this weekend?
A: You can exploit prop trends by tracking usage and injuries: RB/WR absences shift scoring 6–12%, OL injuries cut pass yards 10–18%, and bad weather hikes rushing share 6–10 percentage points.
Q: Which predictive metrics combine best to predict ATS winners?
A: The best predictive combo is higher YPA plus strong third-down offense and low opponent PPG—teams meeting that profile went 18-6 ATS (75%); current examples include Rams, Packers, and New England.
Q: What bankroll and bet-timing rules work best for weekend play?
A: Bankroll and timing rules: target early lines Thu/Fri, re-check Saturday, respect sharp moves ≥1.5 points, avoid public late-money distortion, and line-shop for ≥0.5 points or 5–10 cents ML advantage.