

Think back-to-backs don’t matter for betting? Think again.
League data shows teams on the second night win only about 40 to 45 percent and cover the spread several points less than rested opponents.
Pace, shooting and late-game defense all slip.
This piece breaks the numbers into home and road splits, ATS (against the spread) and totals trends, team archetypes, and practical betting moves.
Thesis: rest isn’t just fatigue, it’s a measurable edge when combined with travel, rotation depth and home court, and you can exploit it if you know which variables matter and when to act.
League‑Wide Performance on Back‑to‑Backs
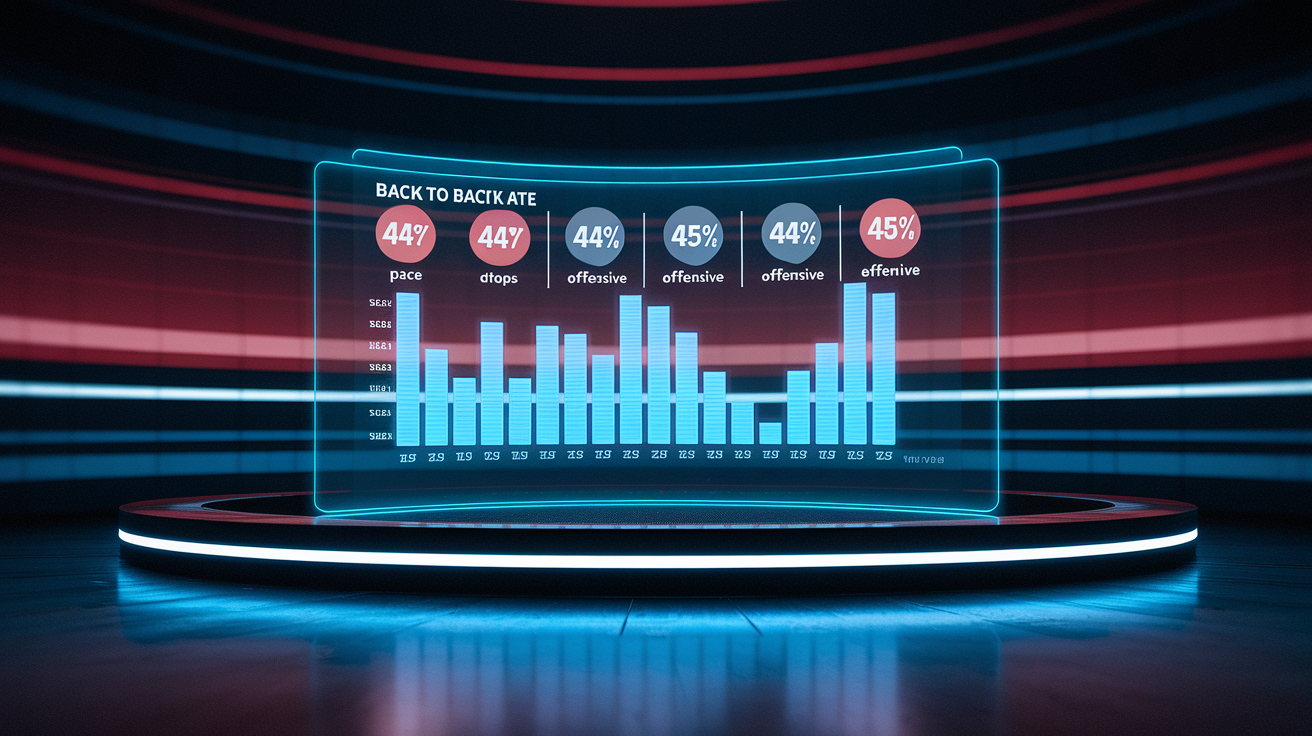
NBA teams playing the second night of a back-to-back win somewhere between 40 and 45% of their games in most seasons. That’s a real drop from the 50% you’d expect if rest didn’t matter. Against-the-spread performance usually falls 3 to 6 percentage points below league average when a team’s on zero rest, and the gap gets worse when travel or opponent rest advantages pile on.
Pace drops on back-to-backs. Teams average roughly 1.5 to 2.5 fewer possessions per 48 minutes when playing their second game in two nights, and offensive efficiency (points per 100 possessions) often dips by 2 to 4 points depending on how deep the roster is and how good the opponent’s defense is. Defensive intensity suffers even more. Late rotations, slower closeouts, fewer contested shots. All of it shows up as higher opponent shooting percentages and more open threes.
The five most consistent fatigue effects you’ll see across league data:
- Reduced first-step speed and transition efficiency, especially in the first and third quarters
- Lower three-point shooting percentage, typically down 2 to 4% compared to rested games
- Increased opponent offensive rebounding rate as boxouts deteriorate late in possessions
- Higher turnover rate in the final six minutes when decision-making slows under physical stress
- Shorter rotations and fewer bench minutes as coaches lean harder on starters to preserve leads or close gaps
Statistical Breakdown by Home and Road Splits
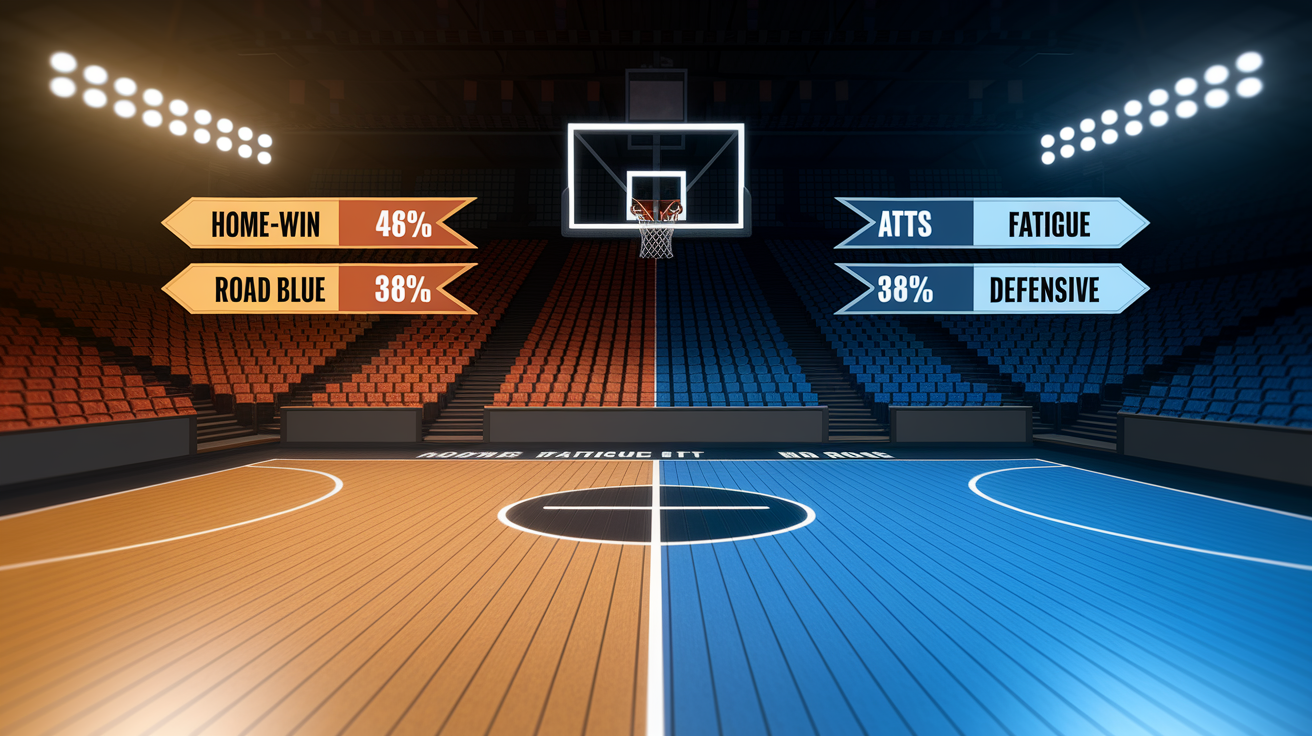
Playing the second leg of a back-to-back at home helps, but it doesn’t fix everything. Home teams on zero rest still win around 45 to 48% depending on the season sample, which is below the typical home-court baseline of about 58%. The home environment shortens travel, preserves sleep schedules, gives coaches access to their own training and treatment facilities. But playing two games in 24 hours still shows up in defensive efficiency and late-game execution.
Road teams on the second night of a back-to-back face the steepest drop. Win rates for road B2B teams typically fall to 35 to 40%, and against-the-spread performance often dips below 45%. Offensive efficiency on the road during B2Bs can decline by 3 to 5 points per 100 possessions compared to rested road games. Defensive efficiency suffers an additional 2 to 3 points as energy reserves run out in the second half.
Key home versus away back-to-back performance markers:
- Win rate: Home B2B around 46%, Road B2B around 38%
- ATS rate: Home B2B around 48%, Road B2B around 44%
- Offensive efficiency: Home B2B down about 2 pts/100, Road B2B down about 4 pts/100
- Defensive efficiency: Home B2B up about 3 pts/100 allowed, Road B2B up about 5 pts/100 allowed
Against‑the‑Spread and Totals Trends
Rested teams cover the spread at a noticeably higher rate when facing opponents on the second night of a back-to-back. Across multi-season samples, the rested side typically covers 3 to 5 percentage points more often than the tired side, and that edge grows when the rested team’s also at home. Market makers know this. Lines often shift 1.5 to 2.5 points to account for the rest disadvantage, but public perception and late-breaking news around load management or injury can create inefficiencies that sharp bettors exploit.
Totals in back-to-back games lean slightly under league-wide. The combination of slower pace, lower shooting percentages, and conservative coaching decisions in blowout situations pushes scoring down by roughly 2 to 4 points per game on average. When both teams are playing on short rest, the under tendency gets stronger because defensive breakdowns and transition opportunities (which normally inflate totals) get offset by poor shooting and reduced possessions.
| Trend Type | Typical Effect | Notes |
|---|---|---|
| ATS (rested team) | Covers around 53 to 55% | Edge grows with home-court advantage and travel disparity |
| ATS (B2B team) | Covers around 45 to 47% | Worse on the road; slightly better at home with no travel |
| Totals (one B2B team) | Under hits around 52 to 54% | Pace and efficiency dips push scoring down 2 to 4 points |
| Totals (both B2B) | Under hits around 55 to 57% | Mutual fatigue compounds scoring decline; fewer possessions |
Rest Disparity and Performance Decline
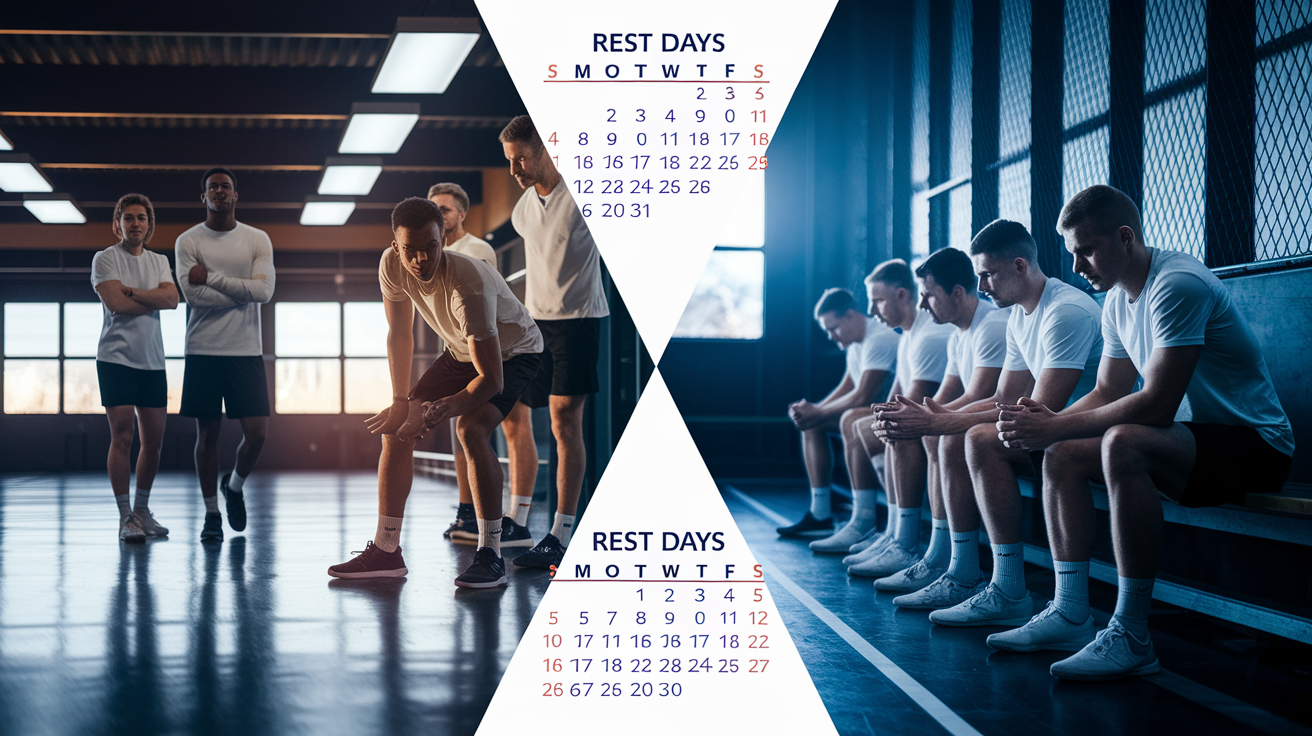
When one team enters a game with at least one extra day of rest, they win 55 to 65% of the time depending on the season and whether other situational factors (home court, travel, injuries) are neutral or favorable. The performance gap isn’t purely physical. Rested teams practice between games, make tactical adjustments, and enter with clearer scouting reports. Zero-rest opponents often skip shootarounds or conduct light walkthroughs to preserve energy.
True shooting percentage drops on back-to-backs. League-wide data shows a decline of roughly 1.5 to 2.5 percentage points, driven mostly by worse three-point shooting and fewer high-quality looks at the rim as fatigue limits cutting speed and finishing strength. Late-game execution suffers the most. Fourth-quarter offensive rating for B2B teams is typically 3 to 5 points per 100 possessions worse than their season average, and that gap widens in close games when starters have played heavy minutes the night before.
Rest disparity creates a compounding advantage when combined with travel. A rested home team facing a road opponent on the second night of a back-to-back wins nearly 70% of the time in some samples. The ATS edge can climb to 6 to 8 percentage points when the market underestimates the cumulative toll of short rest plus overnight travel.
Team‑Specific Back‑to‑Back Patterns
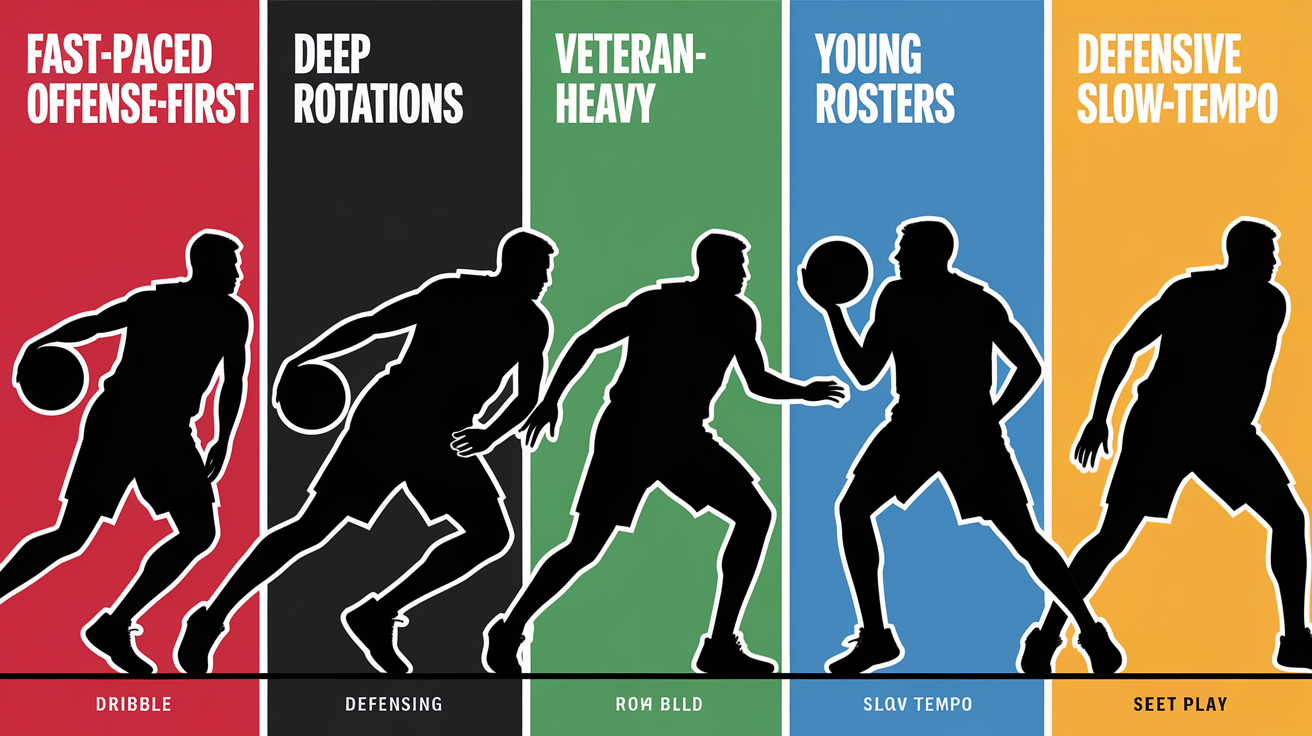
Not all NBA teams handle back-to-backs the same way. Roster construction, playing style, and coaching philosophy create real differences in how fatigue affects performance. Teams that play at a fast pace (averaging 102+ possessions per game) show larger drop-offs on the second night because their style demands high energy on both ends. Slower, half-court teams that rely on set plays and defensive discipline tend to maintain closer to their baseline efficiency even on zero rest.
Deep rotations insulate teams from the worst back-to-back effects. Franchises that regularly use nine or ten players in meaningful minutes can stagger rest for their core and rely on bench production to cover stretches when starters sit. Teams with top-heavy rotations (where three or four players handle 70%+ of the minutes) collapse more visibly on back-to-backs because there’s no safety net when legs get heavy. Age matters too. Veteran-heavy rosters show steeper declines in mobility and shooting on consecutive nights. Younger teams recover faster and maintain defensive intensity deeper into games.
Defensive identity also plays a role. Aggressive, switching defenses that require constant communication and quick rotations break down faster under fatigue. More open threes, higher opponent shooting percentages. Conservative drop-coverage schemes that prioritize rim protection over perimeter pressure hold up better because they demand less lateral movement and fewer high-intensity closeouts.
Common team archetypes and their typical back-to-back outcomes:
- Fast-paced, offense-first teams: Win rate drops 6 to 10%, offensive efficiency declines around 4 pts/100, struggle most on the road
- Deep, balanced rotations: Win rate drops 3 to 5%, maintain defensive efficiency, ATS performance close to league average
- Veteran-heavy, top-heavy minutes: Win rate drops 8 to 12%, fourth-quarter collapses common, strong fade candidates ATS
- Young, athletic rosters: Win rate drops 4 to 6%, recovery advantages offset inexperience, slight lean toward covering on home B2Bs
- Defensive, slow-tempo teams: Win rate drops 3 to 5%, maintain structure, totals lean under, cover spreads more often at home
Applying Back‑to‑Back Data to Betting Strategy
The most common mistake bettors make is assuming every back-to-back creates automatic betting value. Blindly fading road teams on the second night loses money over time because the market already prices in the fatigue penalty. The edge comes from identifying situations where the line hasn’t fully adjusted for compounding factors. Travel distance, opponent rest, roster depth, injury news, recent schedule load. And from spotting public overreactions to single-game narratives.
Situational betting works when you layer multiple rest-related variables. A team on the second night of a back-to-back isn’t necessarily a fade, but a team on the second night after traveling two time zones to face a rested home opponent with a deep rotation? That’s different. That’s where the statistical edge lives. Historical samples show that selective situational angles (especially those combining rest disparity, travel, and home-court advantage) can produce ATS win rates above 54% when applied consistently with proper bankroll management.
Load management adds another dimension. Late scratch announcements for star players can move lines 3 to 5 points in minutes. Public money often overreacts in both directions. If a team rests a key player but has a strong bench and favorable matchup, the line may overcompensate and create value on the B2B side. But when a tired team’s rotation is already thin and they lose another rotation piece to rest or injury, the market sometimes underestimates how badly depth will be exposed.
Six situational angles bettors commonly use in back-to-back scenarios:
- Rest disparity + home court: Bet rested home teams against road opponents on zero rest, especially when travel crossed multiple time zones or the road team played a high-intensity game the night before
- Travel-heavy road B2B: Fade road teams on the second night when they traveled overnight across two or more time zones and are facing a rested opponent
- Totals in mutual fatigue games: Bet under when both teams are playing on short rest, pace is expected to drop, and neither team has strong bench scoring
- Load management overreactions: Bet B2B teams when a star player rests but the backup rotation is deep and the opponent’s style favors the bench-heavy lineup
- Young/deep vs. old/thin: Favor younger teams with nine-man rotations when facing older, veteran-heavy opponents on back-to-backs, especially in the second half of the season
- Late-line movement tracking: Monitor odds shifts in the final hours before tip when injury reports confirm rest decisions; look for overreactions that create value against public sentiment
Final Words
With the second-night horn sounding and legs heavy, league-wide win rates and ATS numbers slide, and pace, efficiency and defense drop enough to change outcomes.
Road teams feel it worse; home teams hold closer to average. Totals skew under and rested teams win a clear majority when rest gaps appear.
Use team-specific patterns, travel strain, and rotation depth to pick spots. Don’t bet blindly. Be selective and size down when uncertainty is high.
If you focus on nba back-to-back betting trends and rest effects, you create repeatable edges. Stay patient; there’s upside here.
FAQ
Q: What is the league-wide win percentage on back-to-backs?
A: The league-wide win percentage on back-to-backs is typically 40–45% for the second-night team, meaning they lose slightly more often than they win versus rested opponents.
Q: How do back-to-backs affect team performance and what fatigue effects should I watch?
A: Back-to-backs reduce pace, true-shooting percentage, defensive intensity, late-game execution, and rotation depth, all of which cut scoring efficiency and clutch performance on zero‑rest nights.
Q: How do home versus road splits change back-to-back outcomes?
A: Home versus road splits show second-night road teams lose an extra 4–8% compared with home B2B teams, which stay closer to league averages but still show defensive-efficiency drops.
Q: How do back-to-backs impact against-the-spread and totals trends?
A: Back-to-backs shift ATS toward the rested team by about 3–5%, and totals lean slightly under because pace and scoring efficiency fall on zero‑rest nights.
Q: How much does a rest disparity (one team with extra rest) change the result?
A: A rest disparity of one or more days gives the rested team a 55–65% win range, with the tired team showing notable declines in true shooting and late-game execution.
Q: Which team types handle back-to-backs better or worse?
A: Fast-paced, older, or shallow-rotation teams tend to drop more on B2Bs; deep, younger, defensively strong teams show smaller declines—check minutes, style, and bench depth per franchise.
Q: How should bettors apply back-to-back data to their strategy?
A: Use B2B data by weighing rest disparity, travel, altitude, home/road splits, rotation depth, and recent minutes; be selective—blanket bets against tired road teams usually aren’t profitable long-term.